Know your audience
Everything you need to truly understand your audience
Ticket sales generate a wealth of audience data. In ticketmatic, you make optimal use of this data: from an integrated CRM to dashboards. This gives you reliable insights for programming, audience development, and strategic decisions.
Trusted by 300+ cultural organizations in Europe


Core features
Turn audience data into action
Smarter communication, stronger relationships, and better-informed choices – directly from your ticketing data.

One central data source
Manage all your customer data in an integrated CRM, without relying on external systems or vendor lock-in.

Immediately usable insights
Use interactive dashboards to analyze trends in sales, behavior, and audience composition – in real time and visually.
Full control over your data
Keep your data clean with automatic deduplication and let your audience manage their own information via the website or the app.
Ready for smart segmentation
Easily filter by preferences, behavior, or profile characteristics to communicate and evaluate in a targeted way.

Audience CRM
Manage and leverage your data
Manage all your customer data in one central environment. Ticketmatic’s Audience CRM is specifically designed for cultural organizations and gives you control over your audience data. Easily create segmentations, view purchase history, and keep your data clean and up to date.


Interactive dashboards
Discover trends and adjust with real-time insights
Gain actionable insights from data with our interactive dashboards. View ticket sales, audience characteristics, and trends in clear visualizations. Use filters to analyze by event, genre, or target group, and uncover patterns in purchasing behavior.

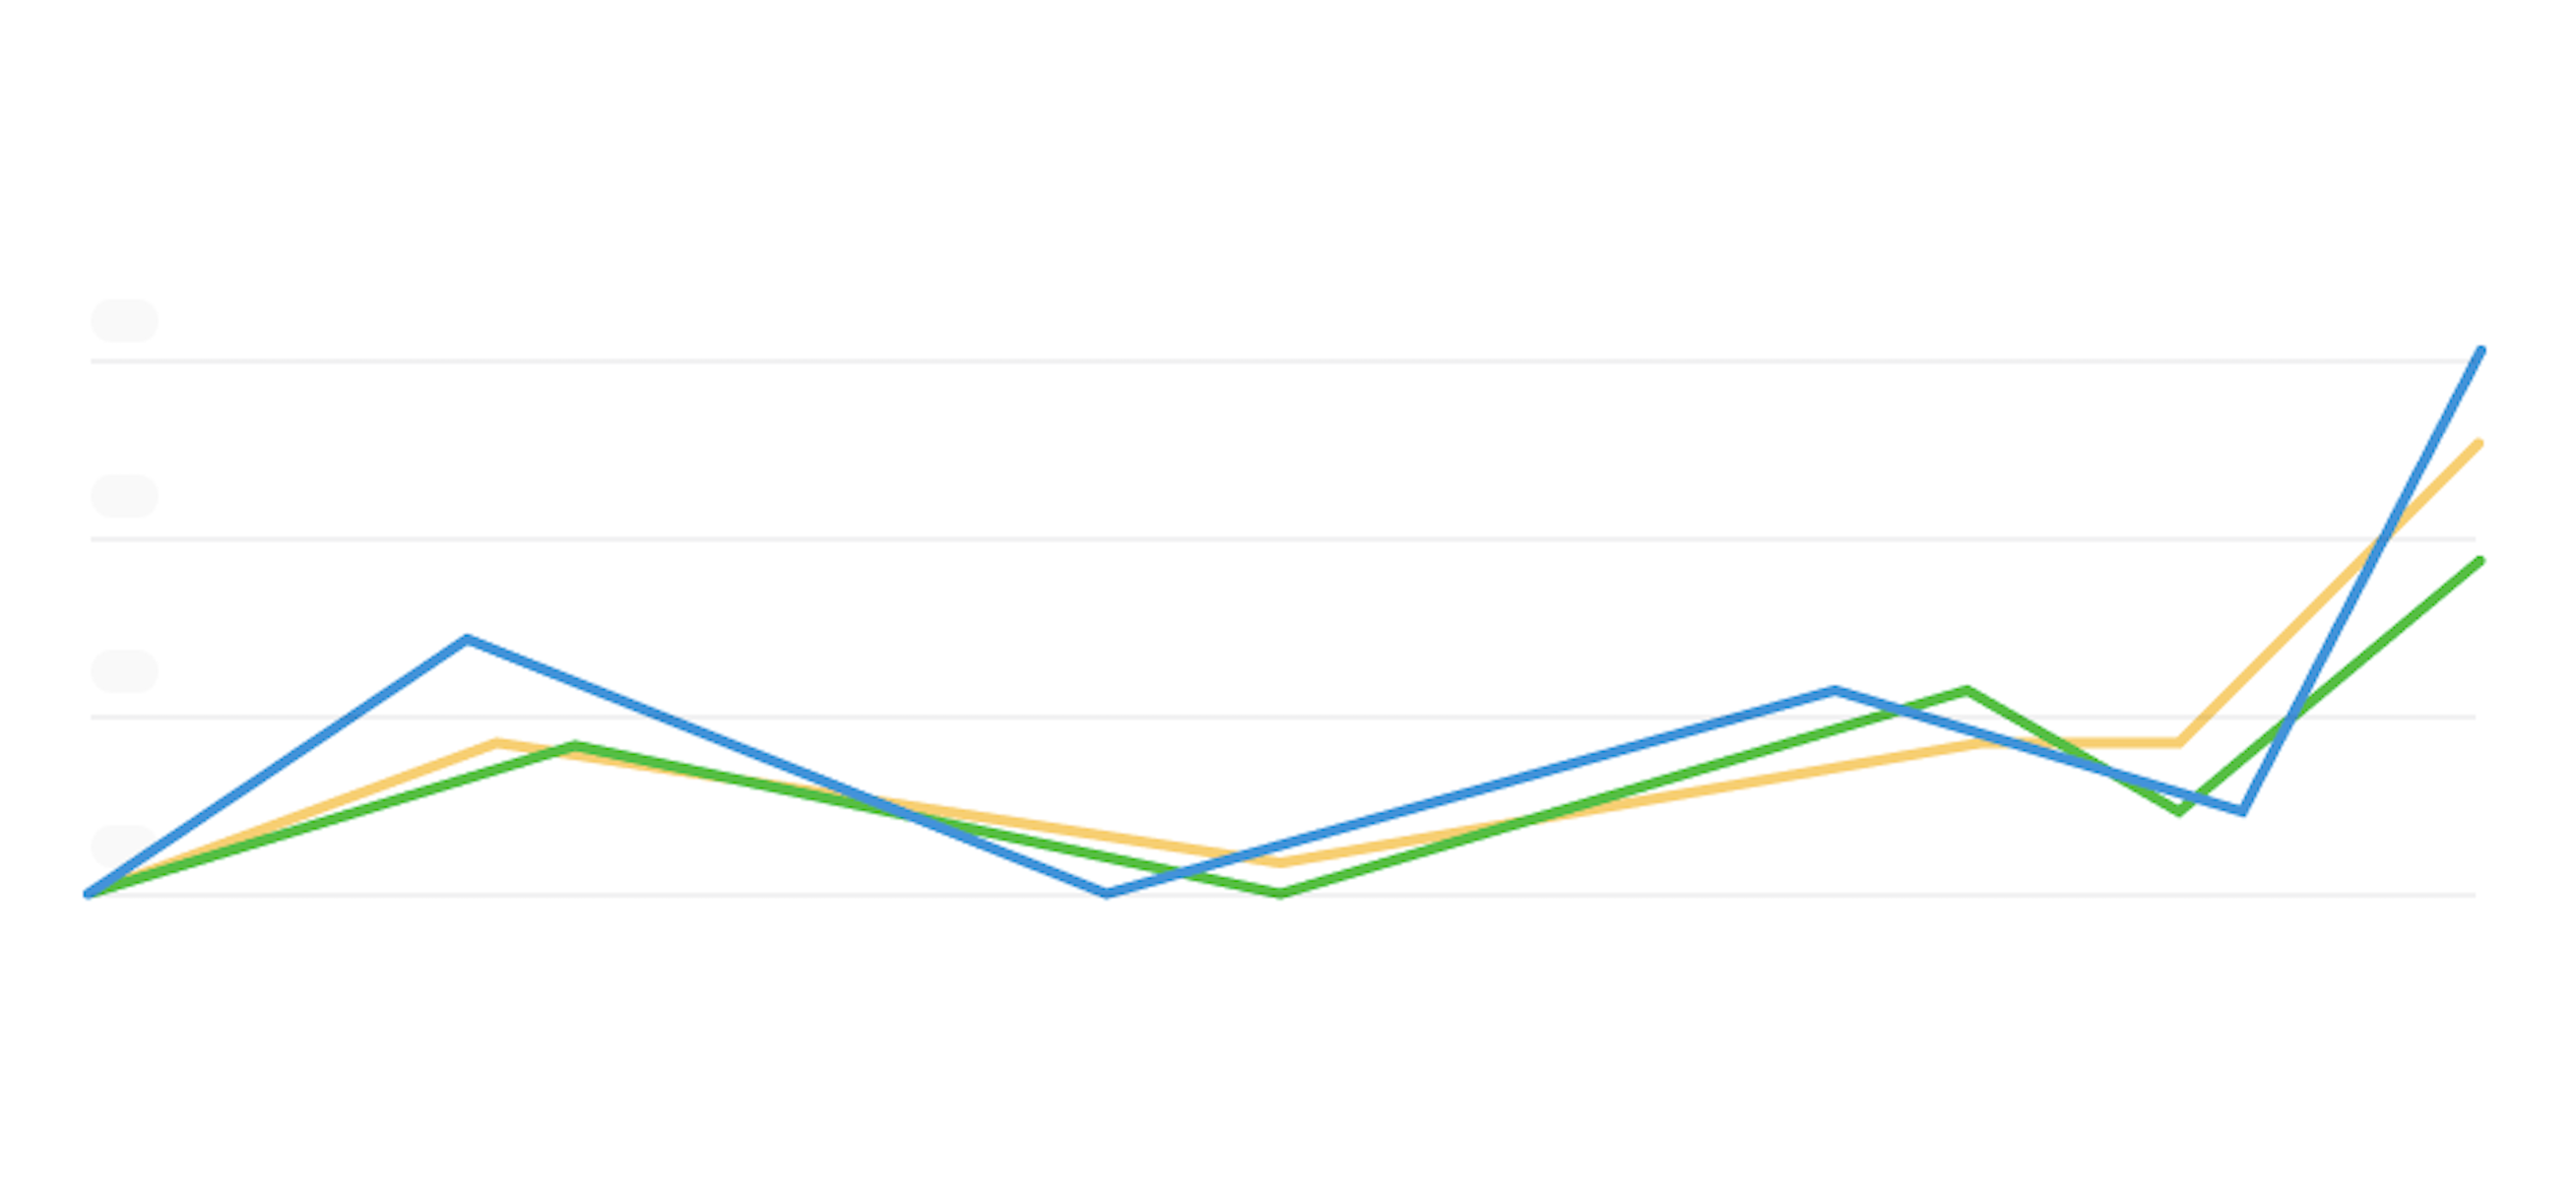
Salesdashboard
The sales dashboard
For each event, a real-time sales dashboard is available that you can easily share with external partners such as promoters, booking offices, or producers. This way, everyone with access always has an up-to-date view of sales – without extra logins or complex reports.

Audience self-service
Aim for more self-reliance
Give visitors access to their own data via a personal account in your ticket shop or through the app. This reduces administrative tasks and increases customer satisfaction.
Audience self-service
Aim for more self-reliance
Give visitors access to their own data via a personal account in your ticket shop or through the app. This reduces administrative tasks and increases customer satisfaction.
Audience self-service
Aim for more self-reliance
Give visitors access to their own data via a personal account in your ticket shop or through the app. This reduces administrative tasks and increases customer satisfaction.
Personal profile with order history
Visitors can review their complete order history, including details for each booking.
Re-download or print tickets
Lost or forgotten tickets no longer result in support requests – customers can retrieve them themselves.
Overview of vouchers and balance
Each customer immediately sees which vouchers are available and the remaining credit.
Manage preferences and newsletter subscriptions
Customers manage their own communication preferences, in line with GDPR rules – fewer manual changes for your team.

Reviews

Frequently Asked Questions
That depends on your own needs. Ticketmatic includes a fully integrated Audience CRM, and integration with an external CRM is possible via our API.
Yes. You choose whether to add to existing data, overwrite it, or only fill in missing fields.
The sales dashboard is available per event and can be shared with external partners in a single click. This way, they always have an up-to-date view of sales.
Yes, all data is continuously updated so you always have current information.
Ticketmatic supports mandatory or optional opt-ins and automatically records preferences in compliance with GDPR.